In portfolio management, delays rarely live in one team. They build in funding cycles, risk reviews, CAB calendars and handoffs. Each function sees part of the picture, but no one sees the whole flow from demand to customer impact.
Without that view, organizations are left guessing which approvals, queues, or policies are slowing outcomes – and improvement efforts chase the wrong problems.
What is Value Stream Mapping
Value Stream Mapping is a structured method to visualize how work actually flows from initial demand to customer impact – including every approval, queue, and governance step along the way.
The mapping session brings together the people who control flow: product, delivery, finance, risk, CAB, and other gatekeepers. You capture waits, work in progress, and the quality of each handoff. The result is a single, evidence-based picture that everyone accepts as the truth – a foundation for changing the policies and cadences that slow delivery.
Originating in lean manufacturing, the method was designed to track material and information flow in production lines. In portfolio management, the format adapts to reflect governance stages, decision owners, and calendar-driven cadences – but the principle is unchanged: make the entire value stream visible, measurable, and actionable.
💡 Use VSM when decision latency appears. Signals include funding approvals trailing market cycles, CAB queues outrunning release capacity, team metrics improving while initiative lead time does not, and risk reviews clustering before board dates. Start with one stream. Map it. Act on the top constraint.
Why Value Stream Mapping works
Value Stream Mapping replaces assumption with a shared, data-backed view of every step, queue, owner, and timing point in the flow. It surfaces non-delivery gates early – investment committees, risk and compliance reviews, enterprise architecture, vendor onboarding, CAB – so they can be addressed before they stall work.
With the full end-to-end picture visible, improvement efforts can target the real constraint, changing funding cadence, decision rights, or policy, instead of applying pressure to delivery teams who aren’t the cause of the delay.
Running a Value Stream Mapping session
Before the session
- Put decision-makers in the room → Product, Delivery, FP&A, Risk, InfoSec, Enterprise Architecture, Procurement, Change Authority. One per gate.
- Define start and stop events → agree the lead-time boundary to avoid timing disputes later.
- Pull evidence → timestamps and WIP from work management, ITSM/change records, finance data, CAB logs.
- Set the outcome → agree the top constraint, name an owner, commit one policy change with a date.
During the session
- Map the current state → steps, queues, calendar cadence, entry criteria, timings, WIP on one page.
- Compare “intended vs actual” with data → timebox each step to 10 minutes, park future-state ideas.
- Capture shadow workflows → add parallel inboxes/manual trackers so hidden waits are visible.
- Quantify the constraint → approximate wait as WIP ÷ throughput to show impact in time.
- Assign accountability as you go → record an owner and the next decision for each gate.
- End with a draft future-state map and one policy to switch on first.
After the session
- Publish a one-page pack → current map, timing bars, queue lengths, owners, targets, next decision.
- Approve one change within 14 days → target and due date for the constraint owner.
- Adjust portfolio mechanisms where the queue forms → change funding thresholds, add a weekly fast track for low risk, expand standard change catalog, automate evidence packs.
- Lock in cadence → weekly 30-minute flow review; re-map in 30–60 days to confirm the queue reduced, not moved.
Example
Every organization’s map will look different. Use this as a guide to the format and what to look for. Populate timings and WIP from systems , not memory.
image:borderless
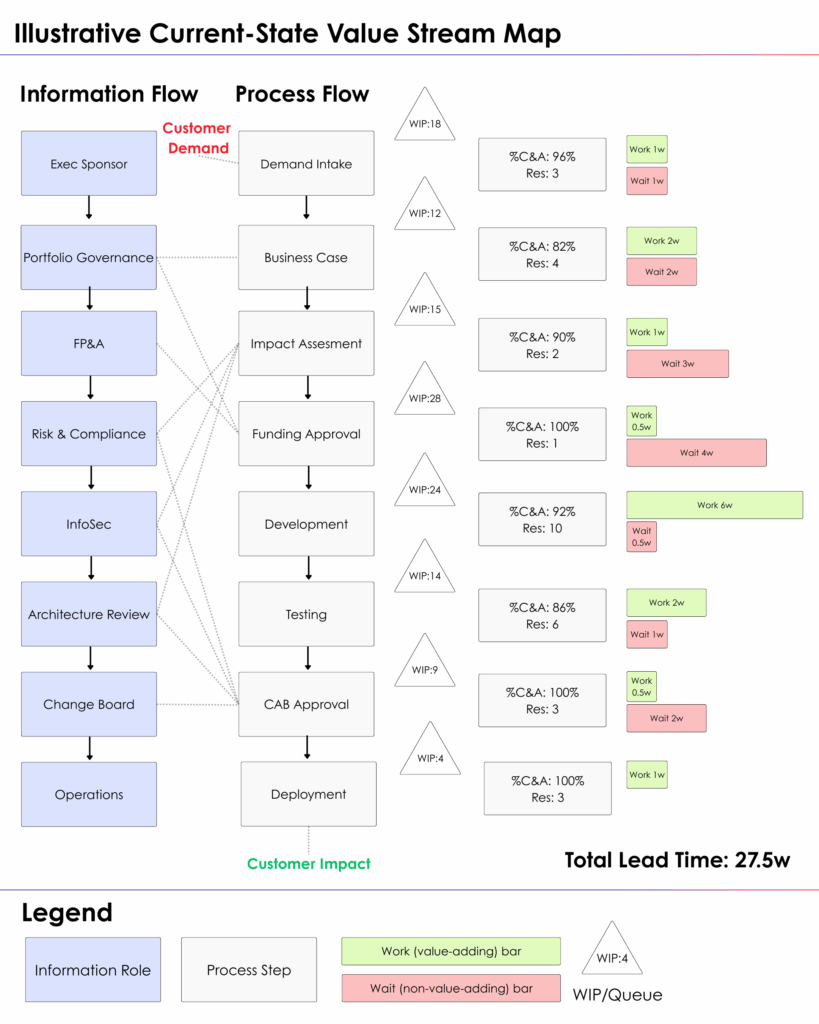
Read this map
- Left column lists decision owners.
- Centre column shows the flow with a data box per step: %C&A and Res. Triangles are queues placed before the step where work waits.
- Right column shows timing on one scale: green work, red wait. Total lead time at the bottom.
What this example highlights
- Funding Approval is the constraint: long wait and heavy WIP. Optimizing Engineering won’t move the total.
- CAB Approval is a secondary delay tied to the calendar.
- Delivery stages show less red than approvals, so local tuning in Dev or Test has limited effect.
Possible solutions to improve lead time
- Fix the constraint first: rolling funding for small items, delegated thresholds, weekly approval cadence.
- Shorten CAB delay: standard-change catalogue, automated evidence packs, risk-based routing.
- Set portfolio targets: reduce total lead time, cap WIP at approvals, minimum %C&A by stage.
- Re-map after 30–60 days and compare the timing bars.
Avoiding common pitfalls
The table below outlines fixes to pitfalls in the Value Stream Mapping process.
| Pitfall | Fix |
|---|---|
| Guessed timings or averages | Pull timestamps and WIP from Jira/Azure DevOps, finance workflow. Snapshot same time. Cite sources on the map. |
| Unbounded scope | Map one value stream end-to-end. Timebox to one day. |
| Lifecycle diagram presented as a map | Use info lane, process boxes with data, WIP triangles, and a timing ladder. No generic lifecycles. |
| Optimizing build while work waits for money/sign-off | Change funding cadence or entry policy before tuning engineering. |
| Missing gate owners | Name FP&A, Risk, InfoSec, Architecture, Procurement, Change control/CAB as step owners. Put names on the map. |
| No approval SLAs | Publish Funding and CAB SLAs (target <1 week) on the map. Review weekly. |
| Calendar batching ignored | Replace quarterly batches with rolling thresholds and a weekly fast-track for low risk. |
| CAB scope too broad | Create a standard-change catalogue (no CAB) and risk-based routing for the rest. Automate evidence packs. |
| Wrong work items counted | Count Epics/Change records, not Stories. Avoid parent–child double counting. One tier only. |
| Missing %C&A at handoffs | Add %C&A per step; use checklists to raise it upstream. |
| Designing future state during discovery | Freeze current-state. Schedule design as a separate session. |
| No owner for the constraint | Assign a named exec with a target and review date visible on the map. |
| No WIP limits at approvals | Cap WIP per gate. Pause intake when caps are hit. |
| Shadow workflows not captured | Find parallel inboxes and manual trackers. Add them and measure those queues. |
| No re-map to prove impact | Re-map in 30–60 days and compare timing bars to baseline. |
From Value Stream Mapping to Value Stream Management
A map is a baseline, not a fix. It shows where work waits. Management changes the policies, cadences, and decision rights that create those waits. Treat the map as live: set targets, name owners, pull data from systems, review on a fixed schedule. image:borderless
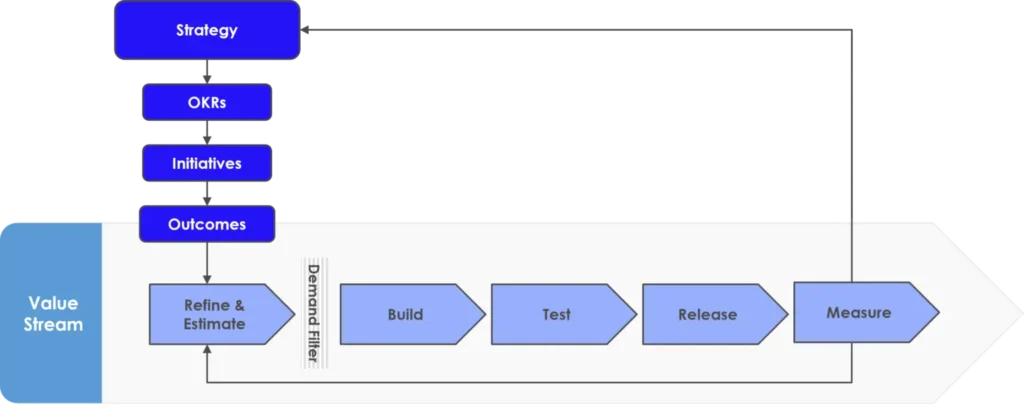
Value Stream Management turns a static snapshot into a sustained practice. You track a consistent set of flow measures and tie them directly to portfolio decisions.
Measure what governs delivery speed: total lead time, wait time, flow efficiency, decision latency, and WIP at approval gates. Use those measures to decide: raise funding thresholds, introduce weekly fast tracks for low-risk change, expand standard change catalogs, automate evidence packs.
Mapping without management is a one-off workshop. Management without mapping is guesswork. Combine them, and you get shorter lead times, faster decisions, and spend aligned to the outcomes that matter.