Book a demo
Strategic portfolio management for finance leaders

Control portfolio cost, from budget to realized benefit

Kiplot gives Finance live control of portfolio cost: what every initiative is consuming, how spend tracks against budget, and whether promised benefits are being realized. Variance is visible in-period, while it can still be corrected.

From spreadsheet sprawl to financial clarity
Tracked in spreadsheets
portfolio_costs_FINAL_v7.xlsx
capex_forecast_v3.xlsx
benefits_tracker(2).xlsx
project_actuals_2026.xlsx
supplier_spend_Q3.xlsx
Portfolio finance · one view
Live, reconciled, one source

Challenges facing portfolio finance

Actuals sit in the ERP, budgets in planning spreadsheets, benefits in the approval deck. Portfolio cost is reconstructed at close, and variance is explained after the fact rather than caught while it forms.

Common reality
  • Spend visible only once it lands in actuals
  • Budgets, forecasts, and actuals reconciled by hand
  • Variance discovered at close, weeks after the spend
  • Benefits promised for approval, never tracked to realization
  • Reallocation and chargeback is a negotiation, not a process
Cost and value under control
  • Live spend by initiative, supplier, and cost type
  • Cost tracked against budget continuously, not at close
  • Variance flagged as it forms, with time to respond
  • Benefits tracked from business case to realized value
  • Reallocation and chargeback run as a governed process

Move from reconstructing the numbers to controlling the cost

Kiplot connects budgets, spend, and benefits on one governed basis, so Finance sees cost forming across the portfolio instead of discovering it at close.

Strategy

Strategy

The objectives and investment themes that decide where capital should go.

Orchestration

Orchestration

Where budgets, spend, and benefits meet, and the real cost trade-offs get made.

Fund
Measure
Reforecast
Spend & Delivery

Spend & Delivery

Teams spend and deliver, and actuals flow back to steer where capital goes next.

Stay in control from first spend to realized benefit

Kiplot replaces reconciliation with evidence, so Finance spends its time steering cost and value, not assembling the numbers.

What is change actually costing?

Live spend by initiative, supplier, and cost type, without waiting for the month-end pack.

Where is spend diverging from budget?

Track actuals and forecast against budget continuously, with variance flagged as it forms.

Is the forecast still credible?

Test the forecast against run-rate and delivery progress, so the year-end position is defensible.

Are the benefits being realized?

Compare realized value with what the business case promised, and act when the two diverge.

Customer Story

Kiplot powers enterprise transformation

From the 30,000-foot view to the detail that determines success.

Kiplot gives us a 30,000-foot view but also lets us move away from manual processes and dive instantly into the details. We used to spend weeks preparing PowerPoint decks just to report progress. Now, it’s live, always on, and actionable.

Anthony Burrows, Head of Digital Transformation and EPMO at Rakbank
Anthony Burrows · Rakbank
Head of Digital Transformation and EPMO
3×
Profits tripled in three years
98%
Digital transaction volume

Capabilities that put portfolio cost under control

Connect spend, budget, forecast, and benefits evidence, so Finance controls portfolio cost continuously rather than reconciling it at quarter-end.

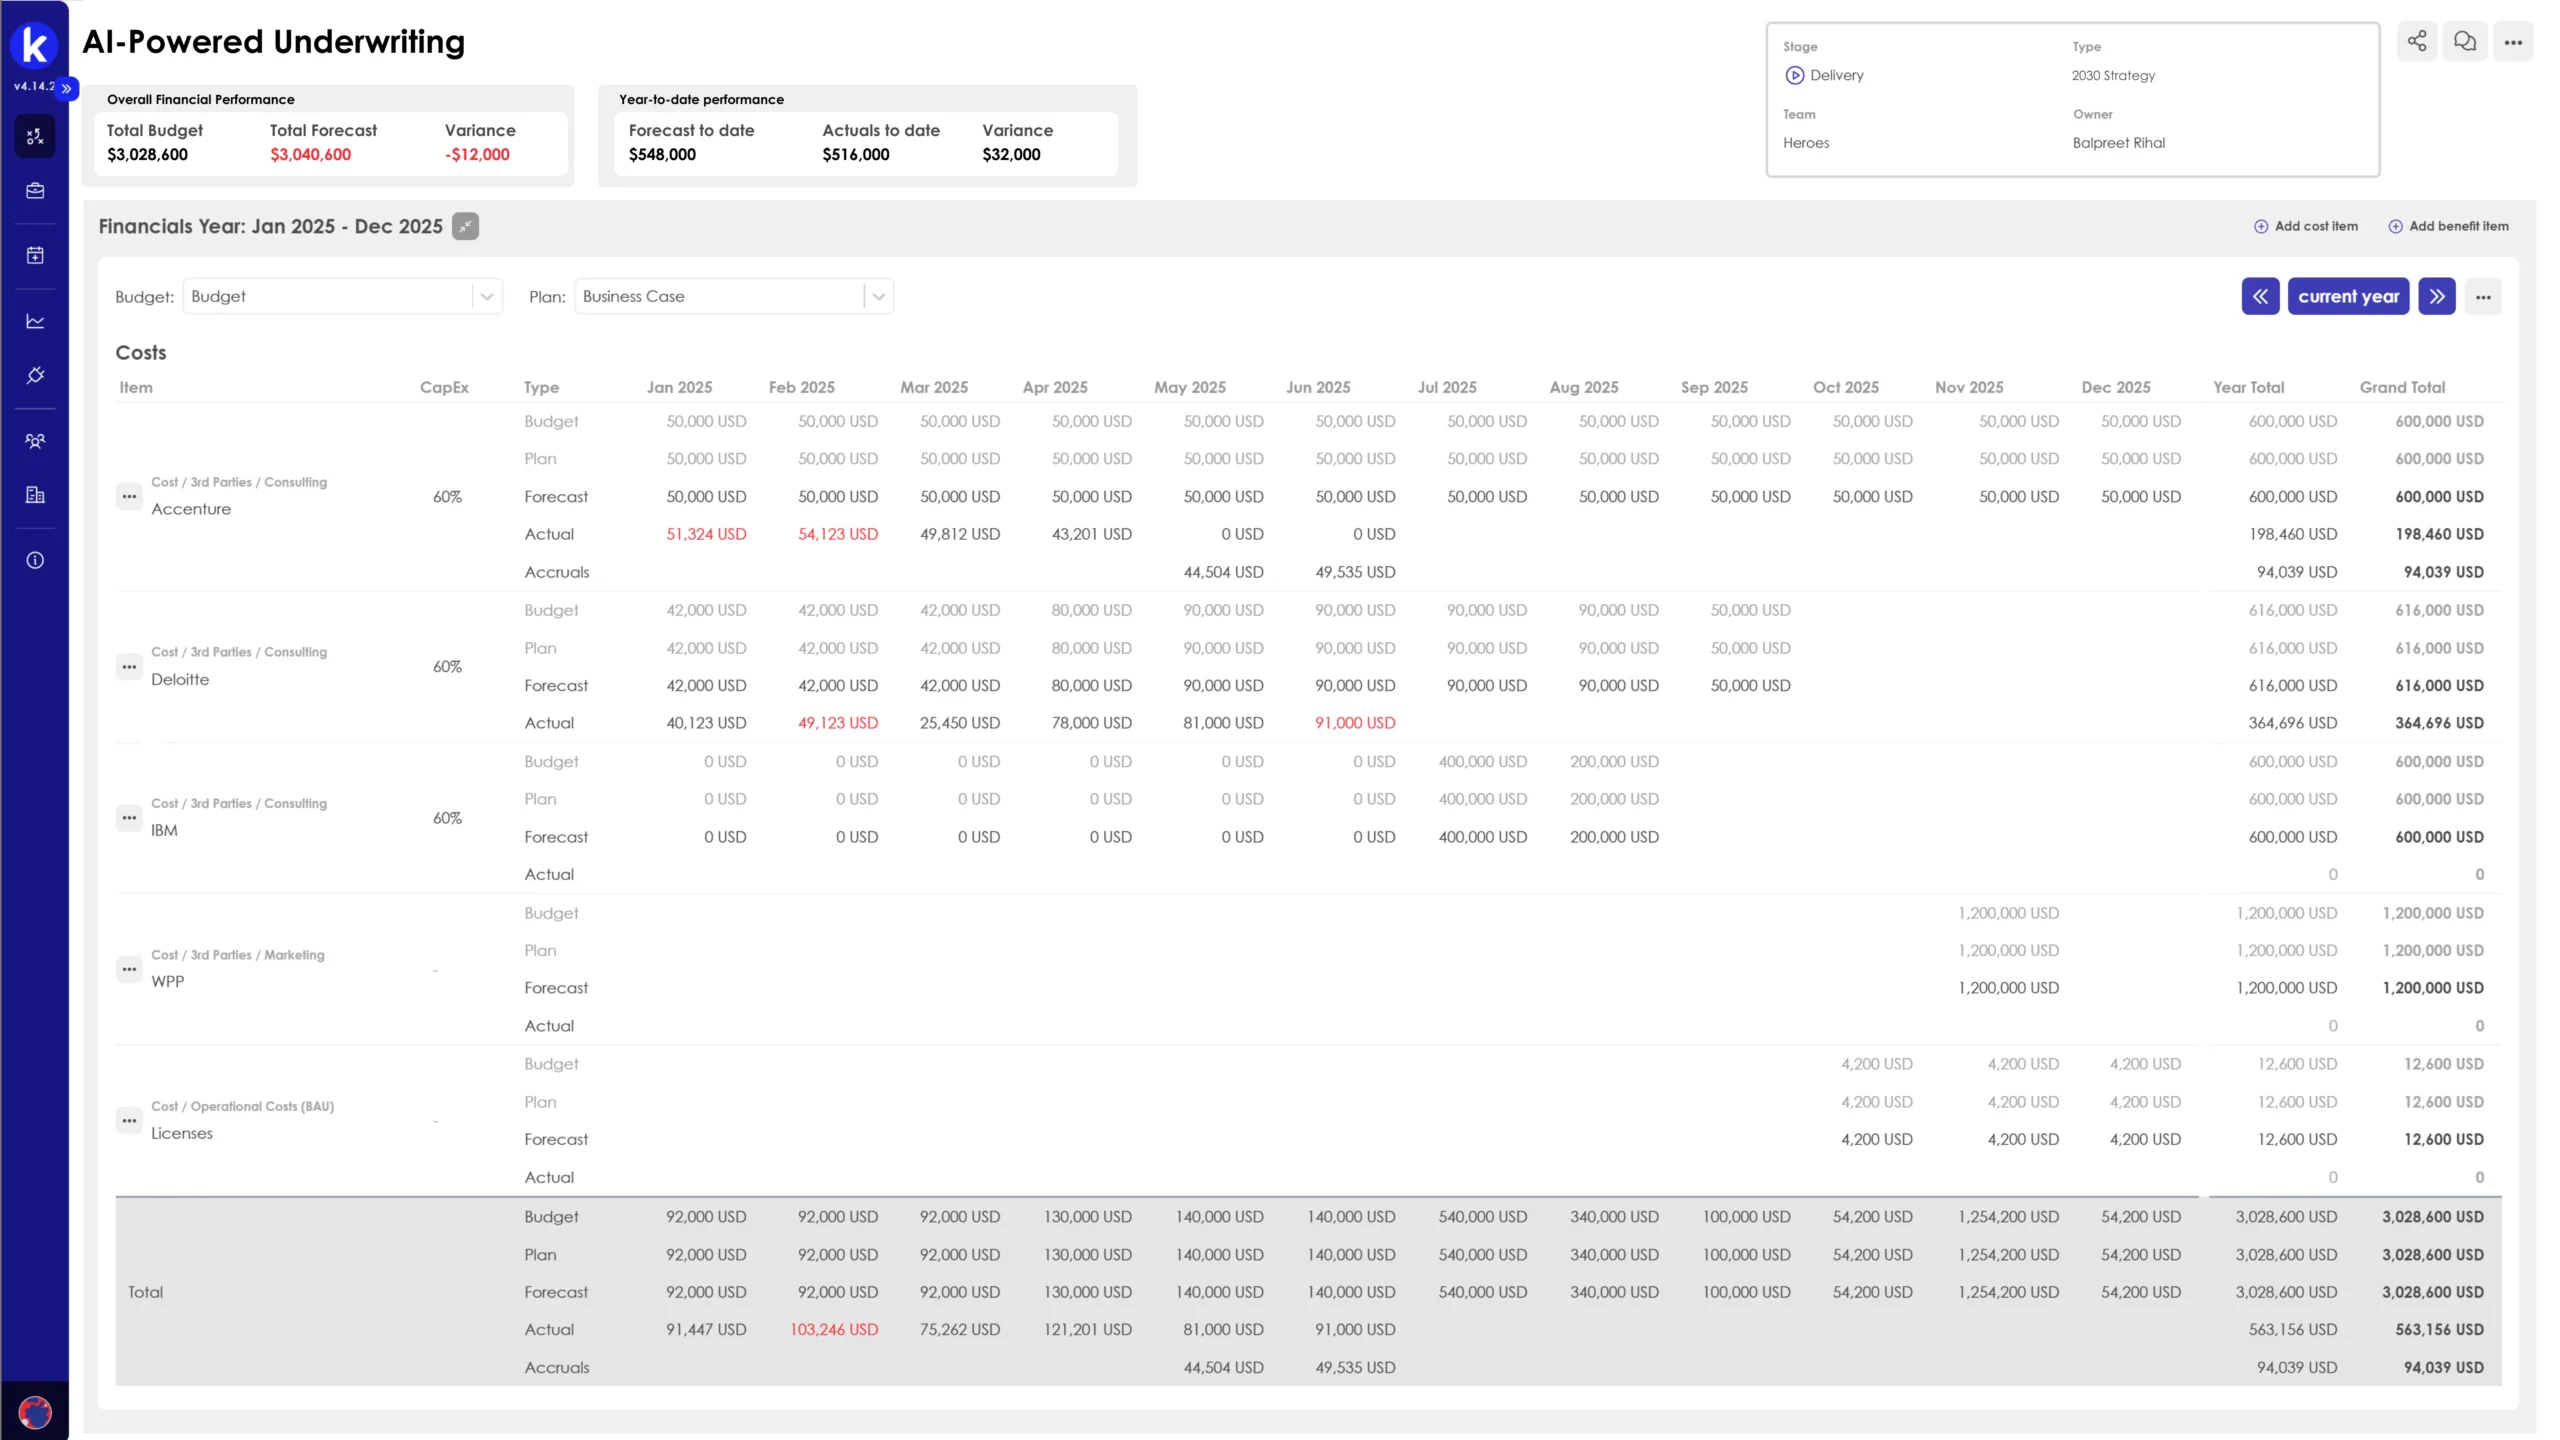
kFinancial StatusBudgettotal:$975,430,040CapEx$782,600,000OpEx$192,830,040Actualstotal:$645,761,730CapEx$511,904,120OpEx$133,857,610Forecast To Gototal:$361,070,000CapEx$289,650,000OpEx$71,420,000Estimate at Completiontotal:$1,006,831,730CapEx$801,554,120OpEx$205,277,610Variance to Plantotal:−$31,401,690CapEx−$18,954,120OpEx−$12,447,570Actual vs. Forecast vs. Budget$0$20M$40M$60M$80M$100M$120MFebMarAprMayJunJulAugSepOctNovDecJanBudgetForecastActualActual vs. Forecast vs. Budget (Cumulative)$0$200M$400M$600M$800M$1,000M$1,200MFebMarAprMayJunJulAugSepOctNovDecJanBudgetForecastActualTop Spending Vendors$0$50M$100M$150M$200MAWSMicrosoftInfosysAccentureIBMOpExCapExInitiative BreakdownValue2026-022026-032026-042026-052026-062026-072026-082026-092026-102026-112026-122027-01TotalAI-Powered Underwriting$360,000$410,000$530,000$420,000$300,000$960,000$340,000$360,000$370,000$310,000$280,000$1,280,000$5,920,000Plan$380,000$380,000$380,000$300,000$300,000$300,000$360,000$360,000$370,000$310,000$280,000$1,280,000Forecast$340,000$360,000$370,000$310,000$280,000$1,280,000Actual$360,000$410,000$530,000$420,000$300,000$960,000$340,000Digital Asset Management System$294,411,000$256,880,000$263,711,000$259,422,000$285,294,000$261,772,000$240,999,000$145,000,000$140,000,000$140,000,000$115,000,000$21,000,000$2,423,489,000
Cost control

See what the portfolio is spending, live

Follow spend, burn, and commitments across the portfolio, from the top line down to the initiative, with capex and opex split at the point of capture.

Learn more
Kiplot capex and opex tracking across portfolio initiatives
Budget & forecast

Cost tracked against budget, continuously

Compare actuals and forecast against budget as delivery moves, so variance surfaces as it forms and the forecast stays defensible.

Learn more
Scenario & trade-off

Model the trade-off before you commit

Compare investment options under different funding, value, and capacity scenarios, and reforecast the financial impact as priorities shift.

Learn more
Kiplot value realization progress, tracking financial and non-financial outcomes against forecast
Benefits realization

Benefits tracked from case to realized value

Track realized and forecast value across the portfolio, so trade-offs and reallocation rest on returns, not on the strength of the last business case.

Learn more

Recommended Reading

Why enterprise organizations choose Kiplot

Enterprise depth without legacy complexity.

AI-Native Portfolio Management

AI is built into how Kiplot analyzes portfolio, financial, capacity and delivery data, surfacing risks, trade-offs and recommended actions inside the workflows teams already use.

Enterprise Depth, Modern Software

Financial control, capacity planning, governance and complex delivery without the usability and administration burden associated with legacy portfolio platforms.

Live in Weeks, Not Years

Start with the workflows that matter, deliver value quickly, then deepen the implementation over time. No multi-year transformation program before the platform becomes useful.

One Layer For Delivery and Finance

Connect portfolio decisions to delivery, financials and capacity in one integrated model, while specialist systems such as Jira, Azure DevOps, SAP, Oracle and Workday remain authoritative.

Configure It Without Consultants

Portfolio teams can configure views, workflows, fields and governance themselves, without development cycles or permanent professional-services dependency.

Two-Way Integrations

Two-way integrations keep delivery and portfolio data synchronized, so teams work in the tools they already use while leaders get a current enterprise view without manual consolidation.

Everything you need to deliver your strategy:

Download the Solution Overview
Move from explaining variance to preventing it See how Kiplot connects spend, budget, forecast, and benefits, so the cost of change stays under control.
See Kiplot in action

Explore more Kiplot capabilities