Book a demo
Portfolio Funding

Allocate capital to outcomes, not just to projects

Kiplot turns budgeting from an annual exercise into a live discipline. Allocate funding to initiatives, track burn against value, and shift capital when strategy demands. No spreadsheet shuffle, no waiting for the next planning cycle.

Portfolio Funding
Enterprise Investment Portfolio
Live
FY 26
Projects
147
↑ 12 QoQ
Budget
$284M
↑ 4% vs prior FY
Total Benefit
$812M
Forecasted
Portfolio RoI
2.9x
IRR 22%
Budget
$284.0M
Forecast
$271.4M
Actual
$187.6M
AWS
$24.3M
Deloitte
$18.7M
Microsoft
$12.1M
SAP
$8.9M
64%
Capex
Capex %64
Opex %36
VALUE-LED ALLOCATION

Fund the outcome, not the loudest request

Stop funding the projects that asked first. Connect every allocation decision to the OKR or initiative it serves, with the value case visible alongside the cost case.

kBusiness Case: AI-Powered UnderwritingFact SheetNameAI-Powered UnderwritingBusiness UnitCore OperationsOwnerHarry BeckStart DateJun 1, 2026End DateFeb 1, 2027Total Cost$5,000,000Approved $4,000,000ROI$3,160,000Benefit less total costPayback Period3.58yearsTarget 3.5 yearsProblem StatementFragmented underwriting systems constrainefficiency and complianceUnderwriting decisions are assembled across foursystems that do not share data. Case information isre-keyed at every hand-off, no single record of adecision exists, and median turnaround stands atnine working days against a market benchmark offour.Compliance reporting is compiled by hand eachquarter, and two of the four systems reach end ofvendor support within eighteen months. Theintegration debt has to be addressed on thattimetable regardless.Underwriters currently spend about a third of eachcase assembling data rather than judging the riskitself.ObjectivesReduce Underwriting Cycle TimeObjective:Automate evidence capture and riskscoring across the underwriting workflow.Measure:Median case turnaround from nine workingdays to three.Improve Decision ConsistencyObjective:Apply model-assisted scoring so everycase is assessed against one standard.Measure:Loss-ratio variance narrowed by 15 percentagainst the prior-year baseline.Strengthen Regulatory AssuranceObjective:Record a complete, queryable audit trailfor every automated decision.Measure:Full traceability on all decisions, evidencedin the quarterly control review.High Level PlanStage GateTask NameSepOctNovDec2027FebtodayPoVClient DeadlineFirst ReleaseGo Live1. DesignGuided Access ControlGranular Audit TrailInitial DesignAuthentication Platform2. BuildMarket Analysis FrameworkCustomer Portal Rollout3. TestE2E TestThroughput Design4. ImplementImplementation ManagementGo Live PlanningBusiness CaseReturn on investmentFY 2026FY 2027FY 2028FY 2029FY 2030FY 2031TotalCost-$5,000,000-$5,000,000Consultancy-$4,368,000-$4,368,000Software-$632,000-$632,000Benefit$2,000,000$1,880,000$1,880,000$2,000,000$400,000$8,160,000Ongoing Cost-$120,000-$120,000-$240,000Revenue$2,000,000$2,000,000$2,000,000$2,000,000$400,000$8,400,000Grand totals-$5,000,000$2,000,000$1,880,000$1,880,000$2,000,000$400,000$3,160,000Payback Plan-$6M-$4M-$2M$0$2M$4M$6M20272028202920302031
CAPEX / OPEX TRACKING

Capitalization integrity, not a month-end reconciliation

Track capex and opex treatment per initiative without manual journal chasing. Real-time visibility into how each dollar is being treated, with the audit trail running alongside.

Kiplot capex and opex tracking across portfolio initiatives
GRANULAR DRILL-DOWN

Drill from portfolio to project to line item

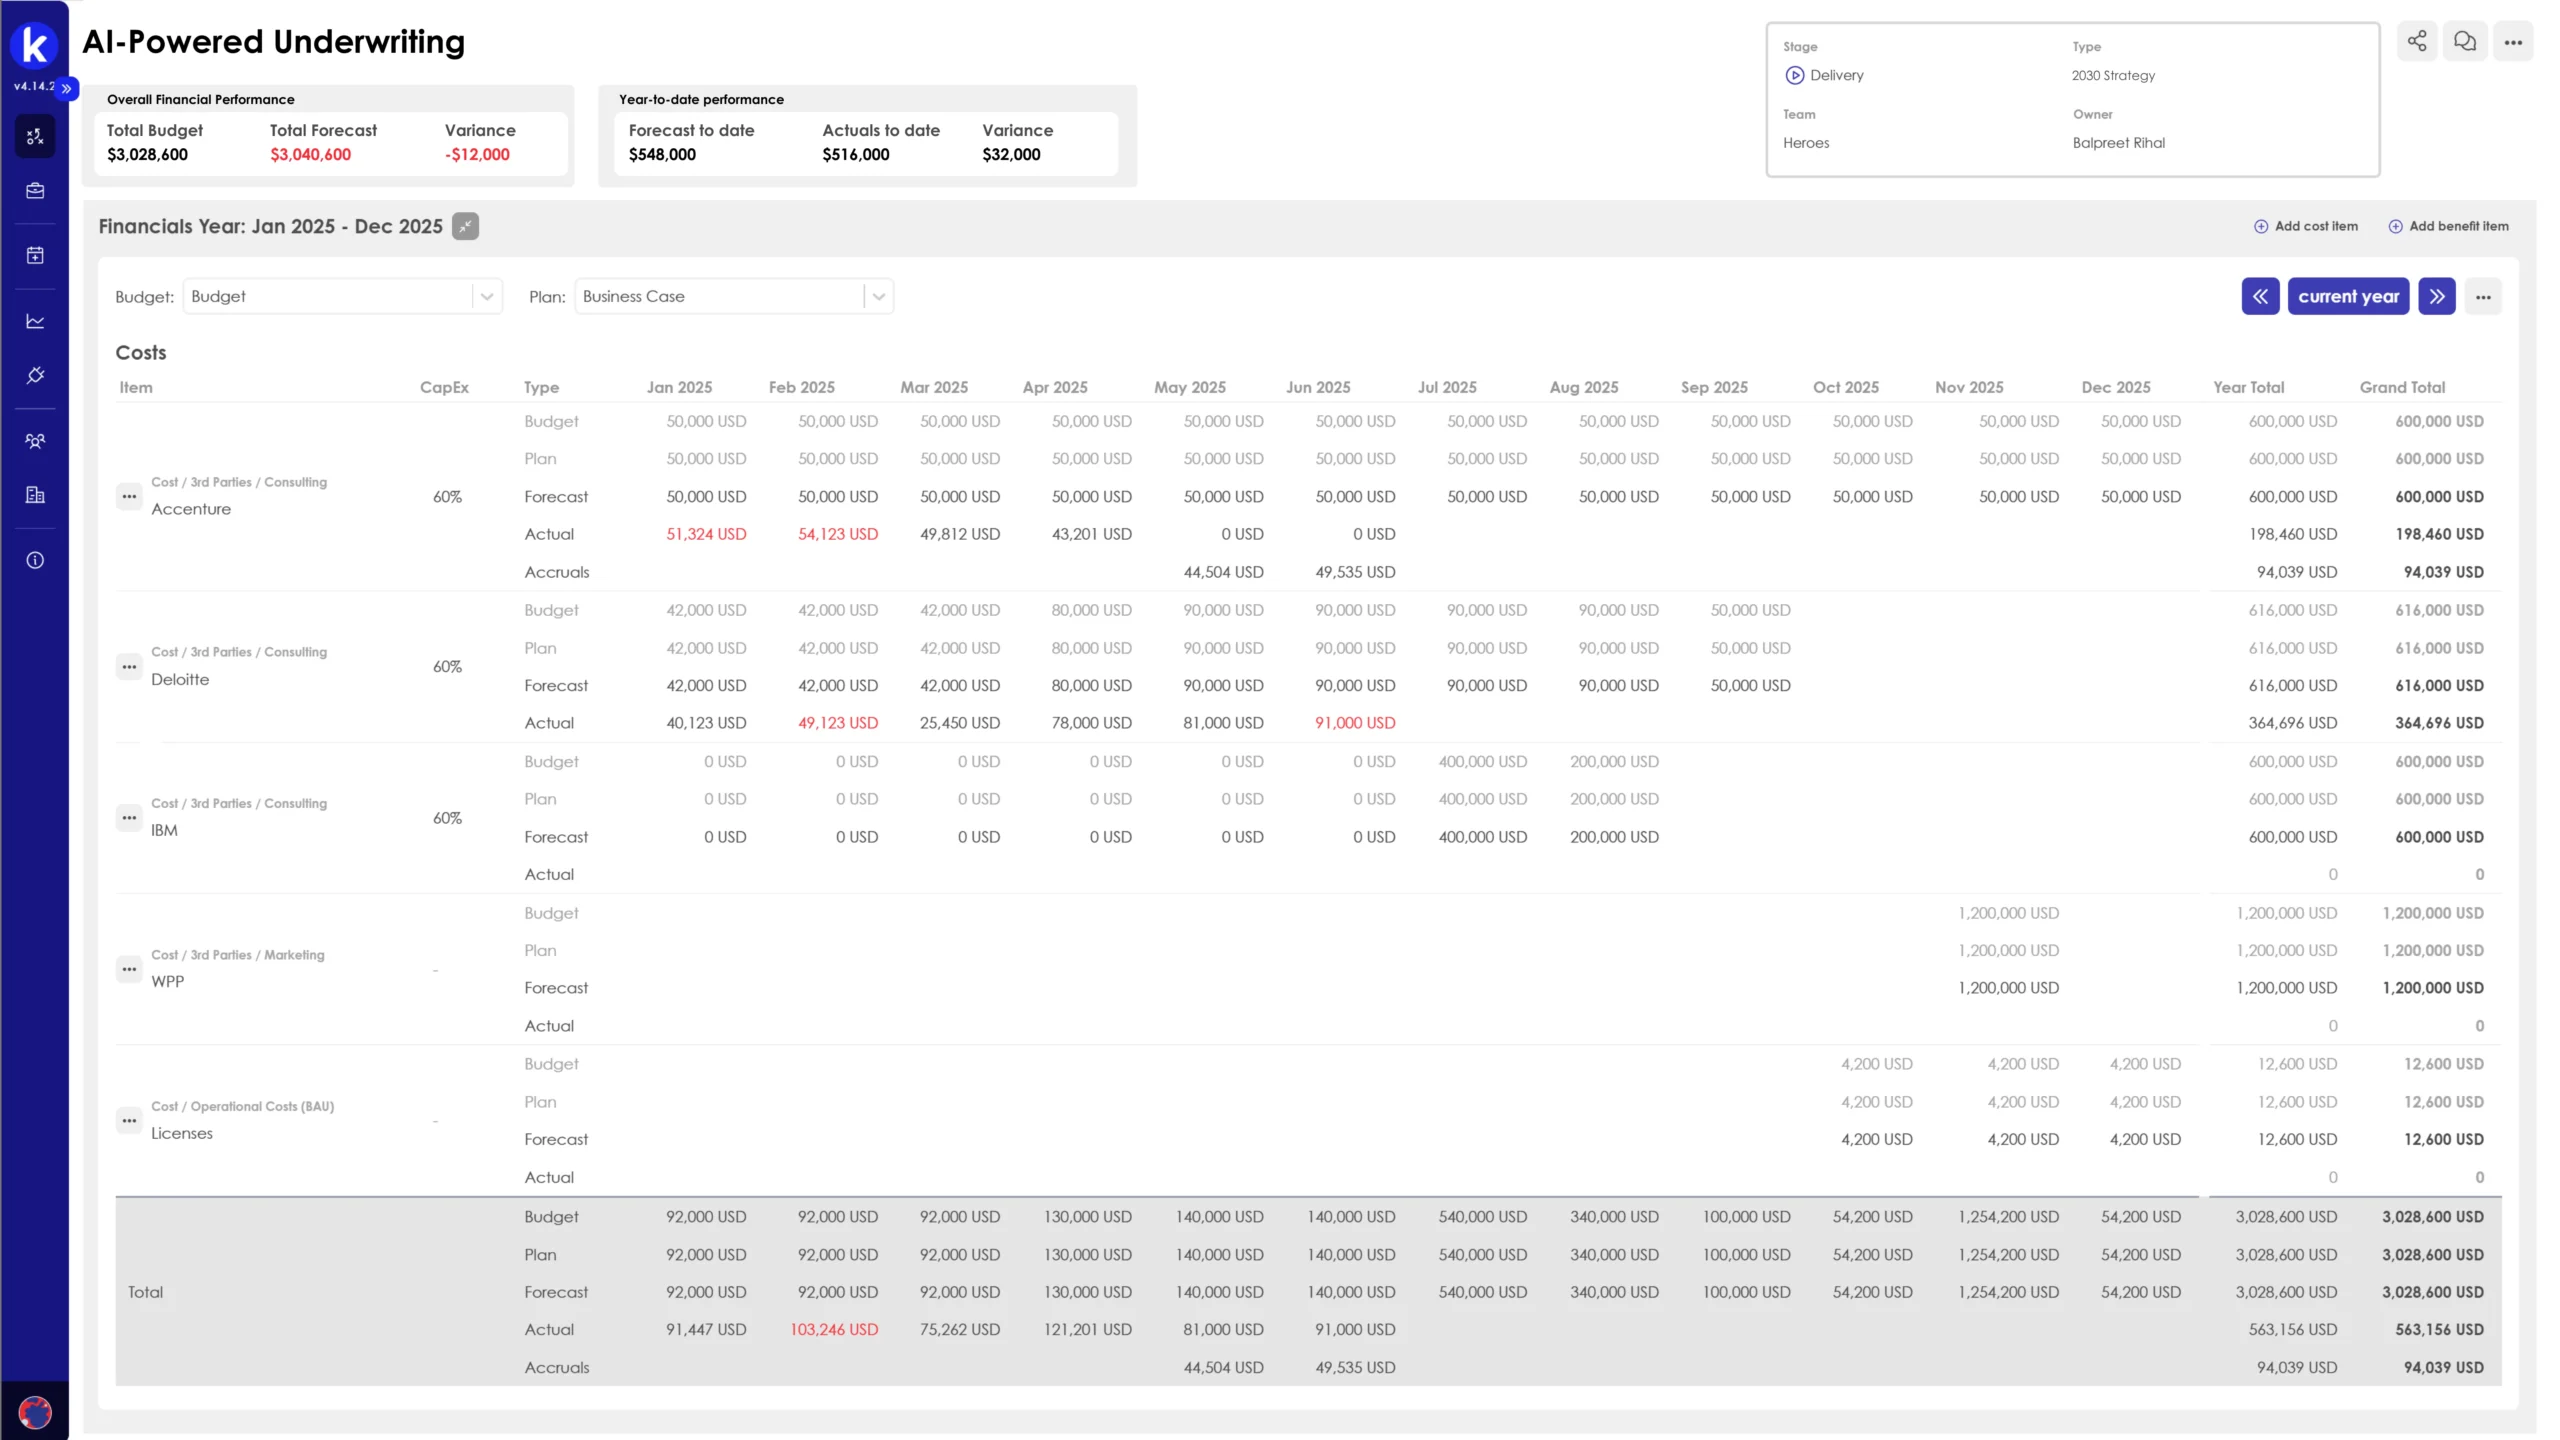
Roll-up financial view at portfolio level, with click-down to initiative, workstream, and individual cost line. Same data, every level of governance, no reconciliation step.

kFinancial StatusBudgettotal:$975,430,040CapEx$782,600,000OpEx$192,830,040Actualstotal:$645,761,730CapEx$511,904,120OpEx$133,857,610Forecast To Gototal:$361,070,000CapEx$289,650,000OpEx$71,420,000Estimate at Completiontotal:$1,006,831,730CapEx$801,554,120OpEx$205,277,610Variance to Plantotal:−$31,401,690CapEx−$18,954,120OpEx−$12,447,570Actual vs. Forecast vs. Budget$0$20M$40M$60M$80M$100M$120MFebMarAprMayJunJulAugSepOctNovDecJanBudgetForecastActualActual vs. Forecast vs. Budget (Cumulative)$0$200M$400M$600M$800M$1,000M$1,200MFebMarAprMayJunJulAugSepOctNovDecJanBudgetForecastActualTop Spending Vendors$0$50M$100M$150M$200MAWSMicrosoftInfosysAccentureIBMOpExCapExInitiative BreakdownValue2026-022026-032026-042026-052026-062026-072026-082026-092026-102026-112026-122027-01TotalAI-Powered Underwriting$360,000$410,000$530,000$420,000$300,000$960,000$340,000$360,000$370,000$310,000$280,000$1,280,000$5,920,000Plan$380,000$380,000$380,000$300,000$300,000$300,000$360,000$360,000$370,000$310,000$280,000$1,280,000Forecast$340,000$360,000$370,000$310,000$280,000$1,280,000Actual$360,000$410,000$530,000$420,000$300,000$960,000$340,000Digital Asset Management System$294,411,000$256,880,000$263,711,000$259,422,000$285,294,000$261,772,000$240,999,000$145,000,000$140,000,000$140,000,000$115,000,000$21,000,000$2,423,489,000

What if month-end took one day?

Book a demo
REAL-TIME REFORECASTING

Reforecast when conditions change, not when the cycle allows

When priorities shift mid-quarter, model the financial impact in minutes. See where capital should move, what the trade-offs are, and what the new outlook looks like before anyone has to write a paper.

Allocate capital to the work that pays back.

Book a demo

Why enterprise organizations choose Kiplot

Enterprise depth without legacy complexity.

AI-Native Portfolio Management

AI is built into how Kiplot analyzes portfolio, financial, capacity and delivery data, surfacing risks, trade-offs and recommended actions inside the workflows teams already use.

Enterprise Depth, Modern Software

Financial control, capacity planning, governance and complex delivery without the usability and administration burden associated with legacy portfolio platforms.

Live in Weeks, Not Years

Start with the workflows that matter, deliver value quickly, then deepen the implementation over time. No multi-year transformation program before the platform becomes useful.

One Layer For Delivery and Finance

Connect portfolio decisions to delivery, financials and capacity in one integrated model, while specialist systems such as Jira, Azure DevOps, SAP, Oracle and Workday remain authoritative.

Configure It Without Consultants

Portfolio teams can configure views, workflows, fields and governance themselves, without development cycles or permanent professional-services dependency.

Two-Way Integrations

Two-way integrations keep delivery and portfolio data synchronized, so teams work in the tools they already use while leaders get a current enterprise view without manual consolidation.

Everything you need to deliver your strategy:

Download the Solution Overview

Explore the rest of the platform

See how Kiplot connects planning, funding, delivery and reporting.