Book a demo
Resource Capacity Planning

Resource and capacity planning that matches what your teams can actually deliver

Kiplot connects portfolio resource demand with available capacity across skills, teams and individuals. Identify constraints, distinguish requested from committed resource, and adjust sequencing, staffing or sourcing before delivery commitments are made.

PORTFOLIO DEMAND & CAPACITY

Compare portfolio demand with the capacity available to deliver it

Capture resource demand by skill, team or individual across planning periods, then compare it with available capacity. See where demand exceeds supply and which constraints require changes to timing, priority or resourcing.

Demand is the STRONGER of the two: the shortfall wedge is the thing the chart exists to show, so it has to be the salient colour, while the capacity mass underneath it stays recessive. --> v4.14.2» Resource Capacity Utilization Overall050100150200JulAugSepOctNovDec2027FebMarDemandSupplytoday Engineering0255075100JulAugSepOctNovDec2027FebMarBusiness Analysis0510152025JulAugSepOctNovDec2027FebMarData Engineering0102030JulAugSepOctNovDec2027FebMarPrompt Engineering0510152025JulAugSepOctNovDec2027FebMarSolution Architecture05101520JulAugSepOctNovDec2027FebMarChange Management05101520JulAugSepOctNovDec2027FebMar
ALLOCATION GOVERNANCE

Control when resource demand becomes a commitment

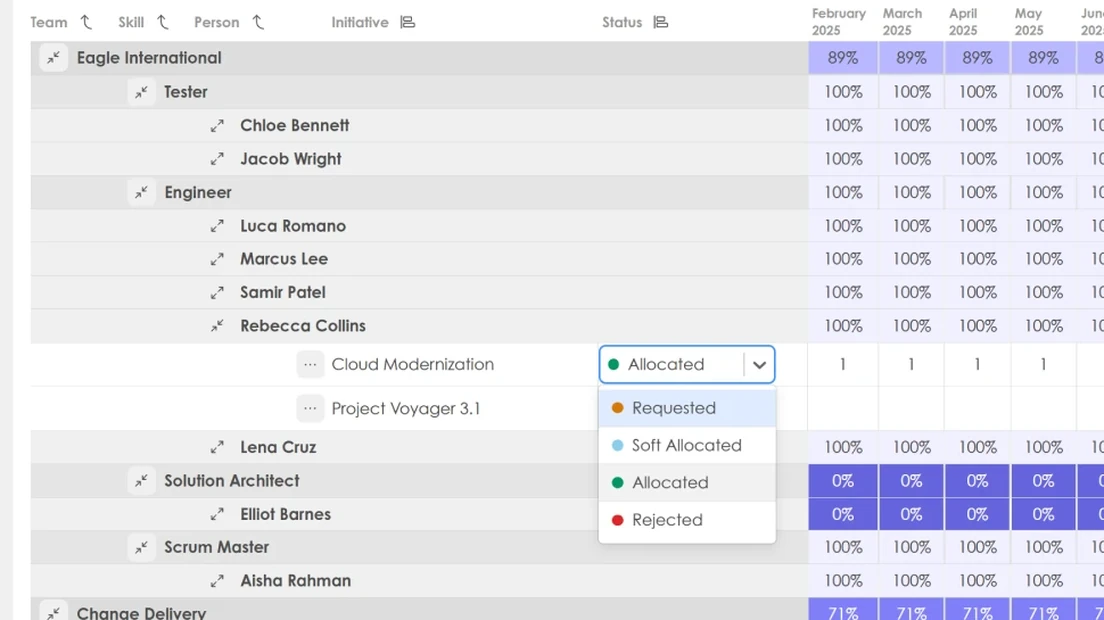
Resource requests can move through Requested, Soft Allocated, Allocated or Rejected states. Portfolio and resource teams can distinguish demand being requested from resource that has been provisionally or firmly committed, creating a clear governance point between proposed demand and confirmed allocation.

Kiplot resource allocation grid with the status of a request being set to Requested, Soft Allocated, Allocated or Rejected

A Kiplot capacity grid, with columns for team, skill, person and initiative, a status column, and one utilization column per month from February to June 2025. Rows nest team into skill into person, and each row carries a utilization percentage for every month. On the row for the Cloud Modernization initiative the status control is open and set to Allocated, listing the four values a resource request can take: Requested, Soft Allocated, Allocated and Rejected.

UTILIZATION

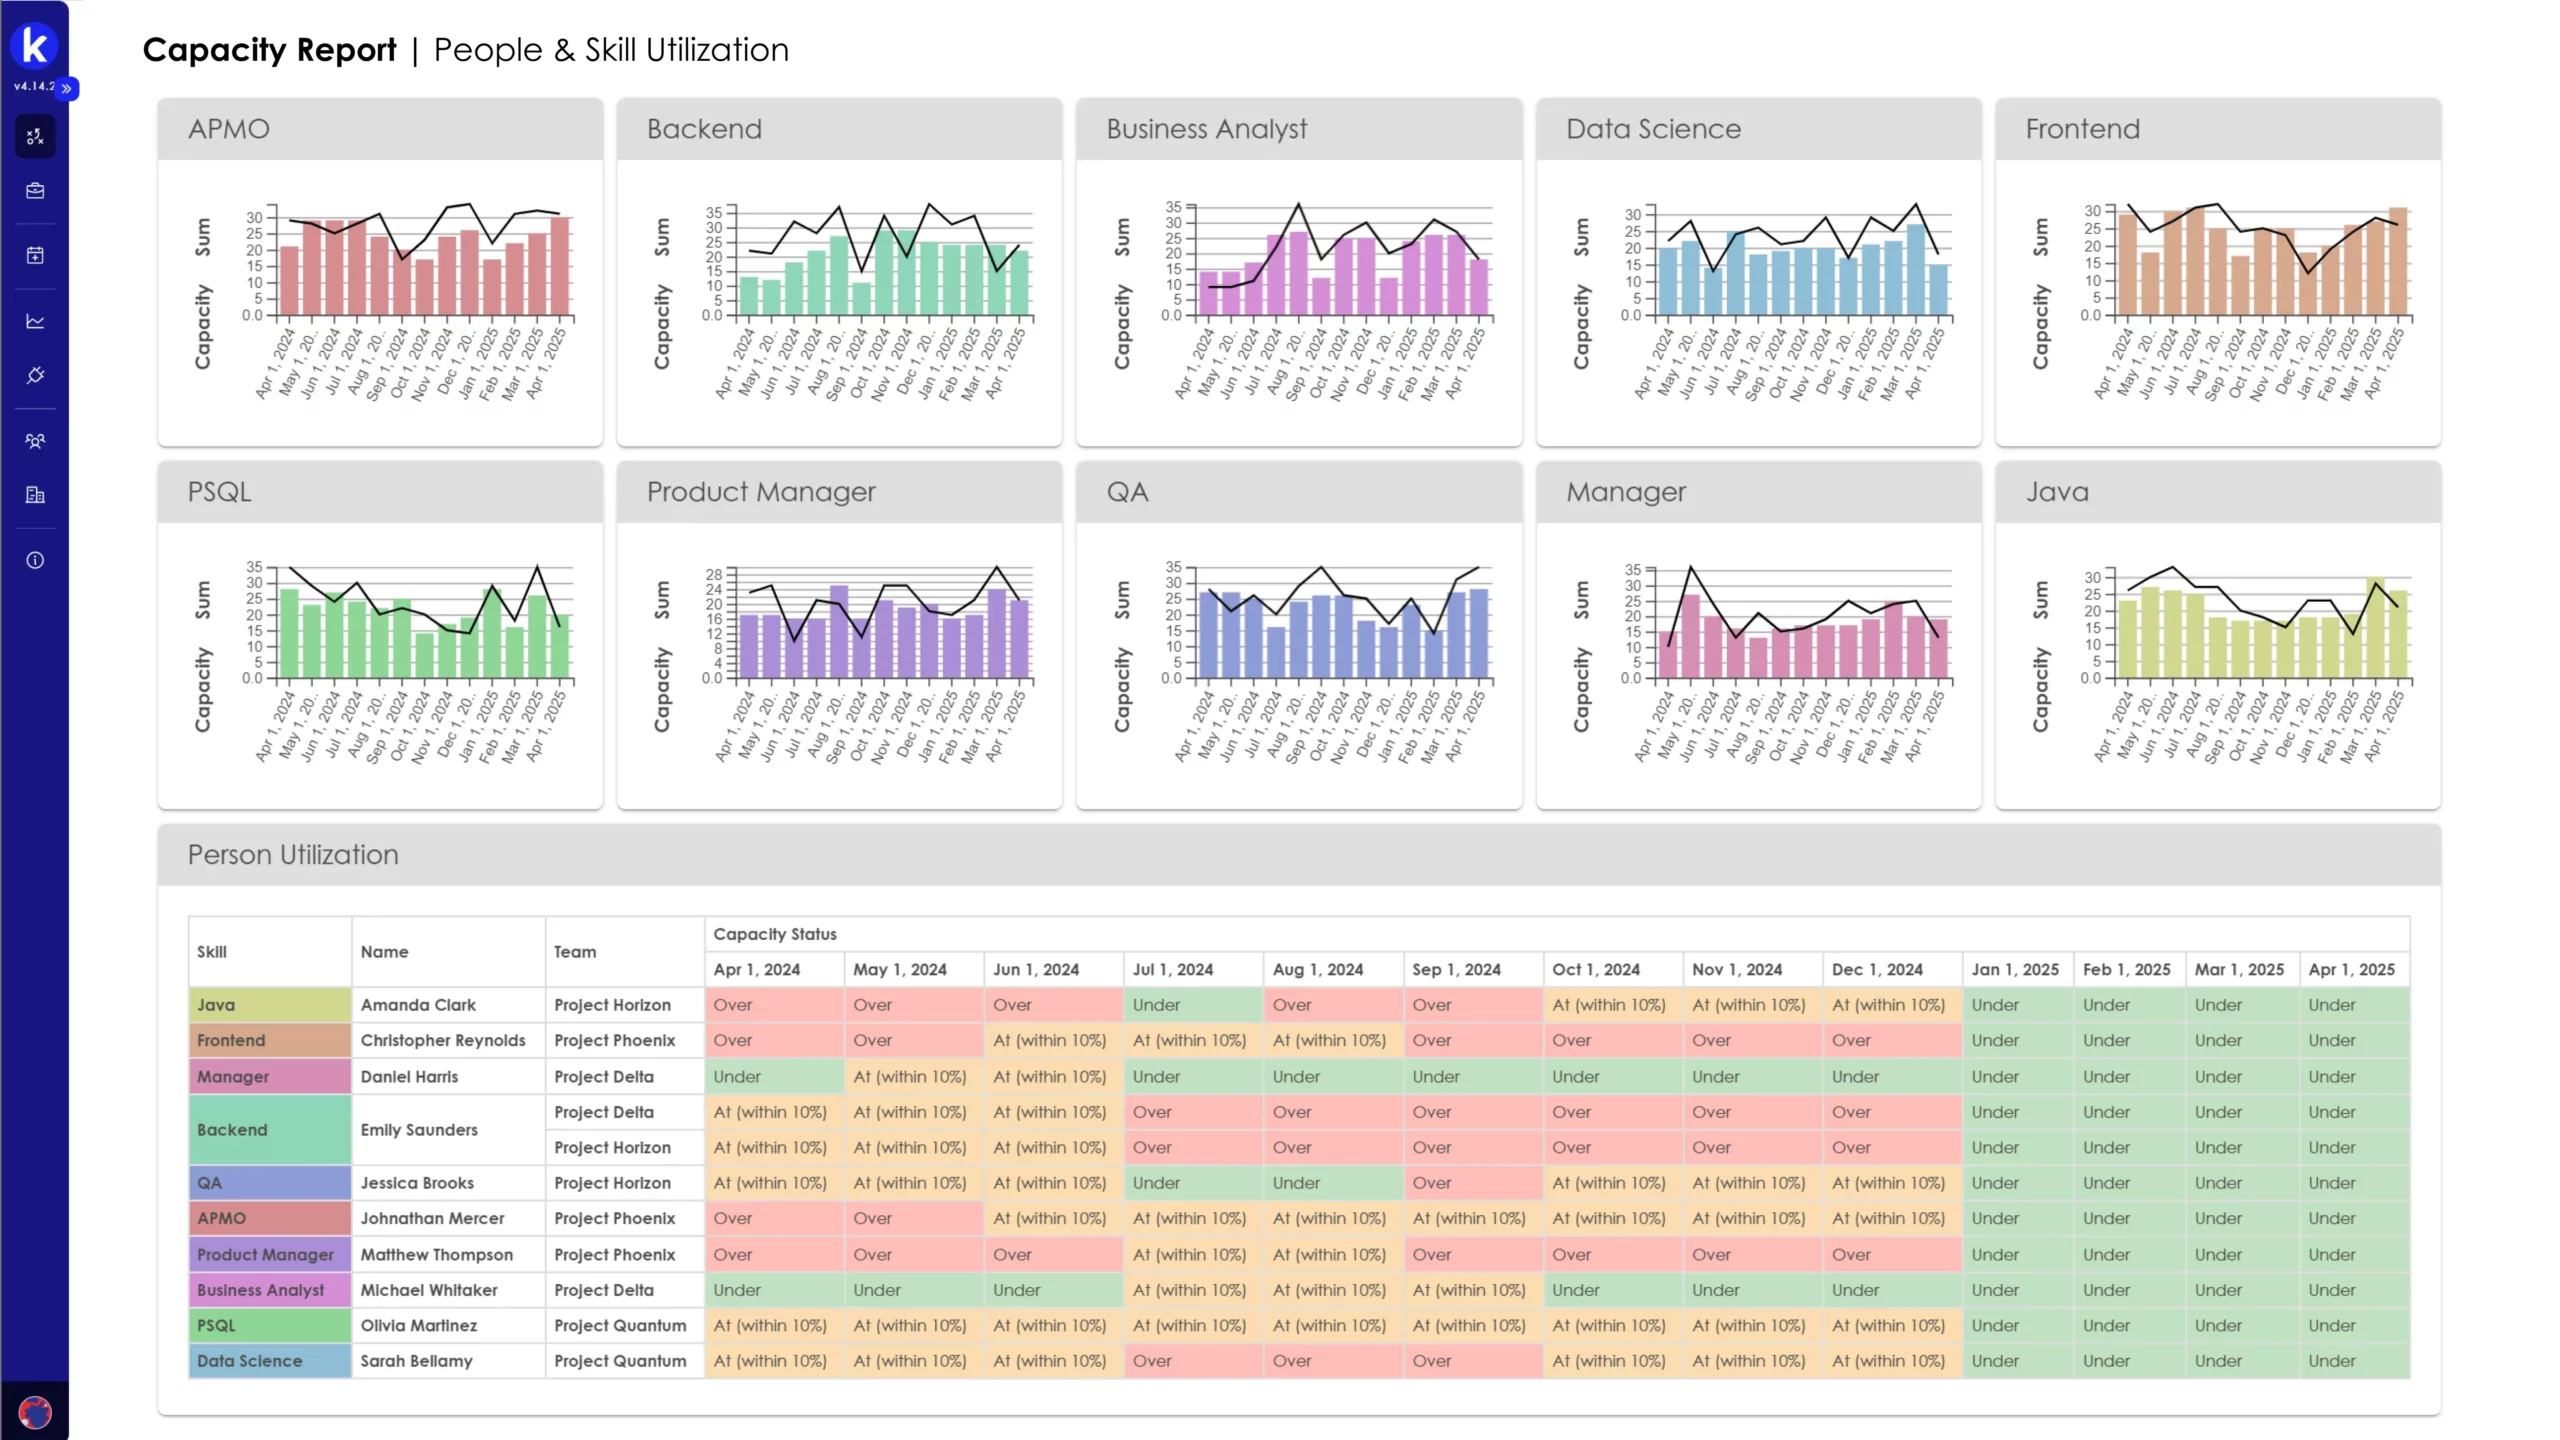
See where teams are over-utilized and where capacity remains available

See how committed demand is distributed across teams and individuals, and where capacity is over-allocated or remains available. Use that view to adjust resource assignments or revisit portfolio commitments.

v5.2.0» Resource Allocation Overview Current periodFilter by TeamShow requested11 Team / Skill / PersonDecisionJun 2026Jul 2026Aug 2026Sep 2026Oct 2026Nov 2026Dec 2026Jan 2027Feb 2027Mar 2027Apr 2027May 2027 Analytics(8)Business Intelligence(2)Enterprise Services(6)Customer Experience(4)Data PlatformKSK7EngineeringAna Sokolova(3)Tom Bright(2)KSK17Solution ArchitecturePriya Raman(2)Marcus Feld(3)KSK13Business AnalysisChloe Vance(2)KSK15Prompt EngineeringNadia Roux(2)(no person)KSK16Data EngineeringInes Halvorsen(3)Yusuf Demir(2) 98%99%99%99%99%110%113%110%98%99%99%100%102%100%101%101%99%98%97%98%97%96%97%99%101%102%102%101%101%100%101%100%100%99%99%99%101%100%100%100%100%100%101%100%101%100%101%101%94%95%96%102%103%106%107%107%102%95%95%95%101%102%103%104%104%103%101%102%102%100%101%102%105%103%105%104%104%104%104%102%104%102%103%104%97%100%101%103%103%101%98%101%99%97%98%100%99%98%97%122%123%123%122%124%123%99%98%98%96%97%96%98%99%99%98%100%98%100%100%98%101%99%97%146%147%146%145%147%148%97%96%97%63%63%62%60%59%59%59%59%58%60%63%60%63%63%62%60%59%59%59%59%58%60%63%60%98%100%101%103%103%104%105%104%103%101%99%96%98%100%101%103%103%104%105%104%103%101%99%96%98%100%101%101%103%118%124%121%103%102%101%101%99%100%102%100%102%131%144%138%103%100%98%98%96%99%100%101%103%105%103%103%103%104%104%103% 6 requests2 requests1 request1 requestClaims Automation Platform0.50.50.50.50.50.5RequestedRegulatory Reporting Uplift0.50.50.50.50.5Soft allocated1 requestData Mesh Migration11111Rejected Allocation State (Underline)RequestedSoft allocatedRejectedCapacity (Heatmap)UnderallocatedAllocatedOverallocatedIndicatorsGroup overflow (overcapacity in child allocations)
SKILLS-BASED PLANNING

Plan delivery against the skills you actually have

View resource demand and capacity by skill, team and individual, so availability can be assessed alongside the capability required for the work. This exposes specialist constraints that simple headcount or utilization totals can hide.

See what your real capacity looks like, on your data.

Book a demo
INTEGRATION

Real-time sync with Jira and Azure DevOps

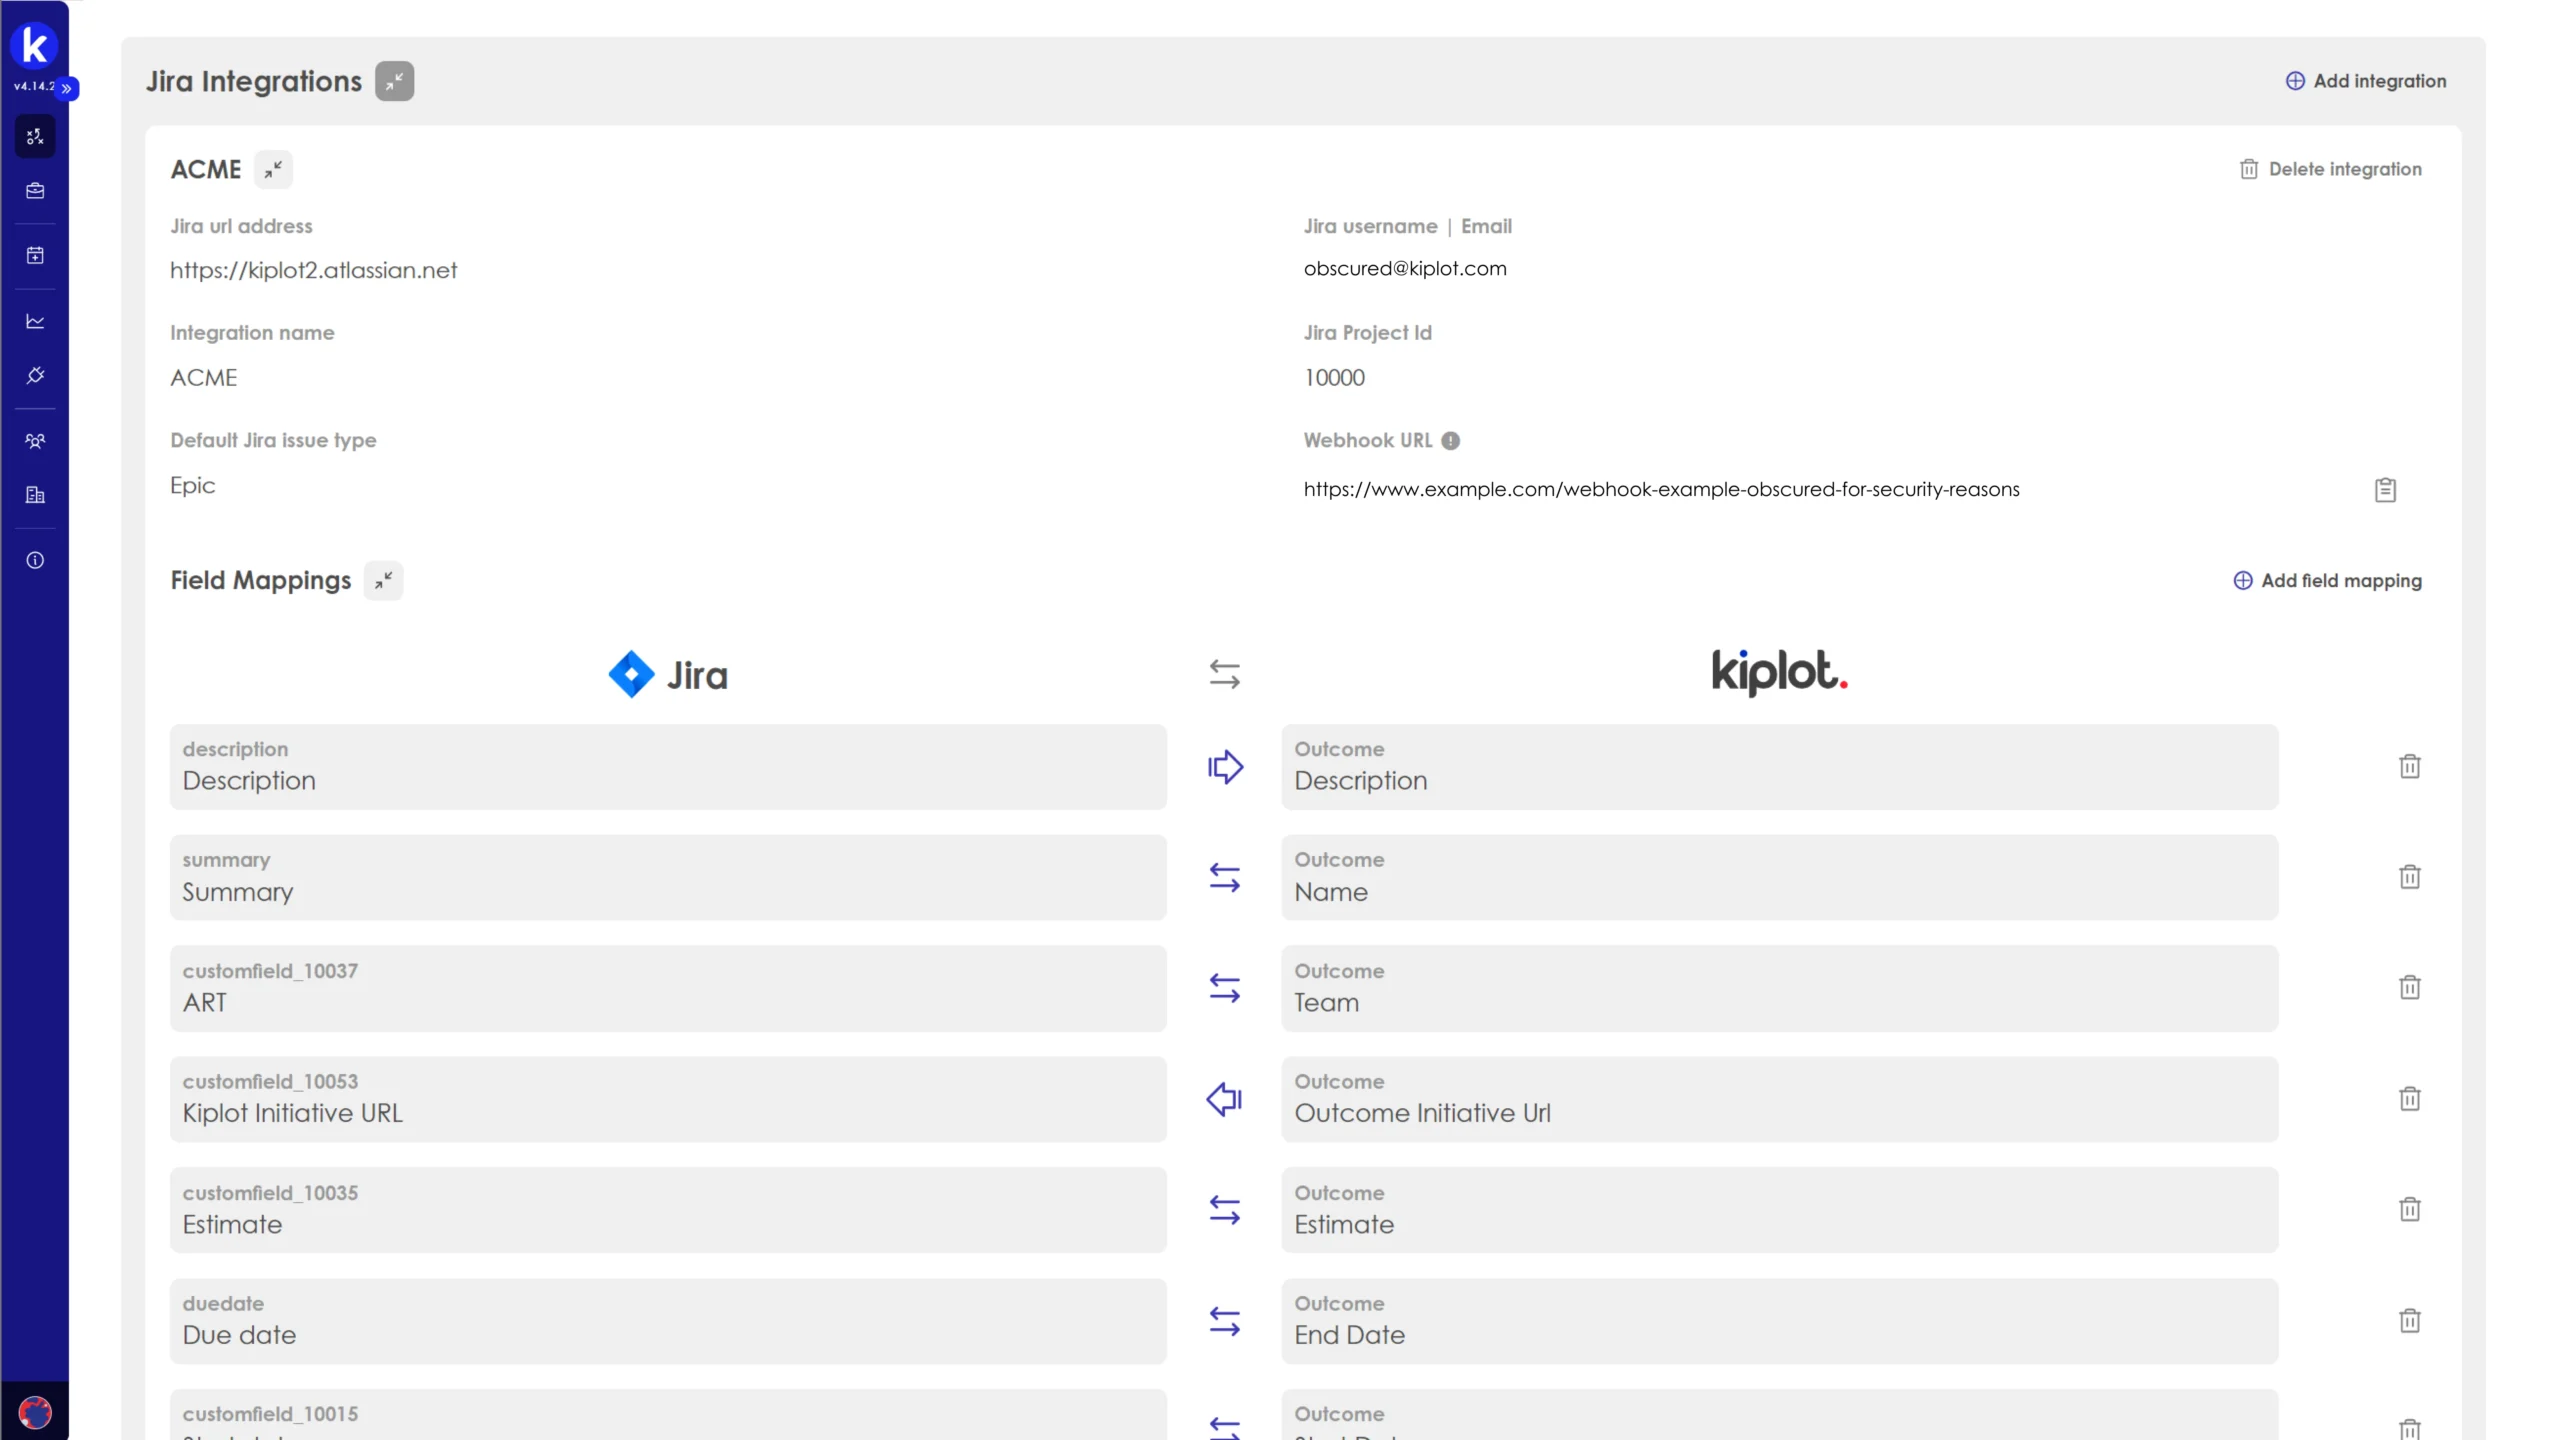
Connect Jira and Azure DevOps delivery data to the portfolio view, reducing the manual work required to reconcile delivery activity with portfolio planning and reporting.

Kiplot integration with Jira and Azure DevOps for live capacity data
FUTURE DEMAND

Anticipate the skill gaps before they hit delivery

Compare the skill mix you have now with the skill mix your future portfolio actually needs. Make hiring, upskilling, and partner-engagement decisions on evidence rather than instinct.

Kiplot skill-gap forecast for upcoming portfolio demand

Stop committing to what you can't deliver.

Book a demo

Why enterprise organizations choose Kiplot

Enterprise depth without legacy complexity.

AI-Native Portfolio Management

AI is built into how Kiplot analyzes portfolio, financial, capacity and delivery data, surfacing risks, trade-offs and recommended actions inside the workflows teams already use.

Enterprise Depth, Modern Software

Financial control, capacity planning, governance and complex delivery without the usability and administration burden associated with legacy portfolio platforms.

Live in Weeks, Not Years

Start with the workflows that matter, deliver value quickly, then deepen the implementation over time. No multi-year transformation program before the platform becomes useful.

One Layer For Delivery and Finance

Connect portfolio decisions to delivery, financials and capacity in one integrated model, while specialist systems such as Jira, Azure DevOps, SAP, Oracle and Workday remain authoritative.

Configure It Without Consultants

Portfolio teams can configure views, workflows, fields and governance themselves, without development cycles or permanent professional-services dependency.

Two-Way Integrations

Two-way integrations keep delivery and portfolio data synchronized, so teams work in the tools they already use while leaders get a current enterprise view without manual consolidation.

Everything you need to deliver your strategy:

Download the Solution Overview

Explore the rest of the platform

See how Kiplot connects planning, funding, delivery and reporting.

Platform & Integrations: Built to fit your enterprise architecture.